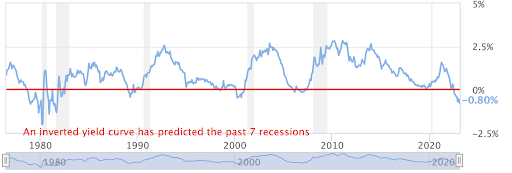
The inverted yield curve has predicted the last seven recessions. And it is inverted again.
2023 kicked off with a promising start for the markets. With investors betting on a pause in interest rate hikes by the Fed, there was genuine anticipation for a slowdown in inflation growth. However, after the reliant US economic data suggested persistent inflation, most investors were inadvertently pushed to the corner, resulting in a steep market decline.
Earlier this month, Bloomberg reported interest spread between the 2-year and 10-year Treasury had reached 86 basis points, the widest since the 1980s, resulting in a more intense yield curve inversion.
What is a yield curve?
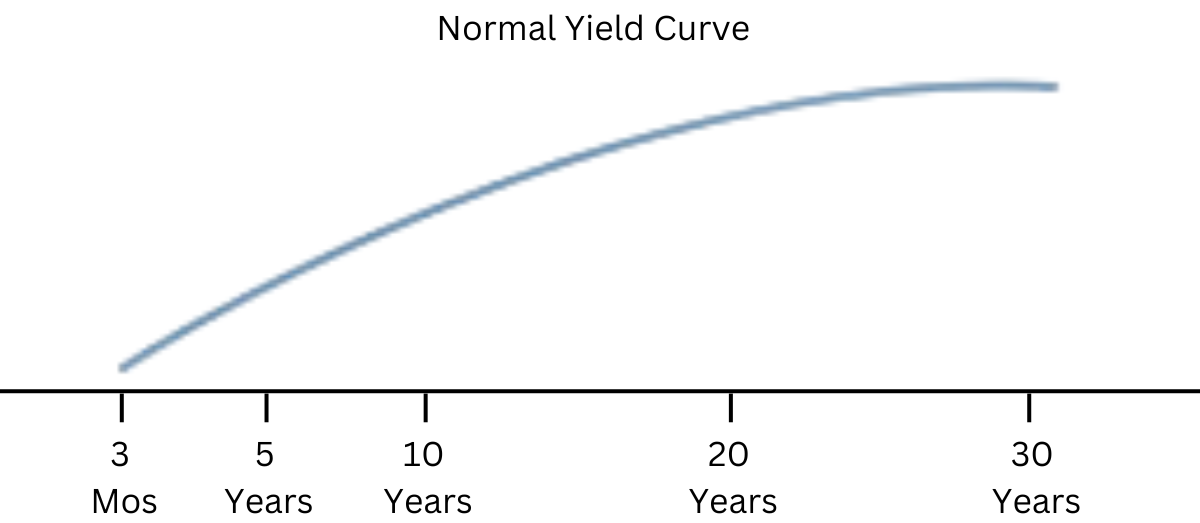
A yield curve is a way to gauge bond investors’ sentiments about risk. It’s a graphical representation of the yields for bonds of equal credit quality and different maturity dates. A typical yield curve looks like something as shown in the below graph.

As seen in the curve above, the interest rates are directly proportional to the time period. For instance, when we’re lending money, the longer the duration higher the risk. And that is why we would demand a higher interest rate to compensate for the risk.
How can a yield curve be inverted?
It is hard to be intuitive about why long-term lenders would settle for lower returns than short-term lenders bearing fewer risks.
When investors expect a downturn in the economy, they expect Fed to cut the interest rates to provide monetary policy support. The expectation of lower future interest rates reduces longer-term rates while keeping short-term rates higher based on current dynamics.
An inverted yield curve often forewarns a stagnating economy, followed by a financial slowdown or an outright recession and lower interest rates along all yield curve points.
As shown below, the inverted yield curve has predicted the last seven recessions. And it has been inverted since July 2022.

Source: Federal Reserve
Why times are no different even presently?
Ten-year yields lower than two-year yields have been a status quo since July. It corresponds to the presumption that elevated policy rates will take an economic toll.
Regardless, the cooling energy prices and solid consumer reports suggest otherwise concerning this inversion. Yet, the data also indicated some stress for American consumers whose wages failed to keep up with churning inflation, persistently pressing them to draw down savings. Loftier borrowing costs and soaring prices are already affecting the housing and auto market significantly. Moreover, we are witnessing a slowdown in corporate earnings, and the recent layoffs visibly imply the similitude of the curve all these seven years – times are no different now.
Although most investors have priced in some embodiment of a mild recession, they should tread the stock market carefully. The growing interest rates may ripple further correction in the markets.
Investors should focus on good quality stocks that continue to sustain interest rate pressure, have strong balance sheets, free cash flows, and margins, and are still trading at a reasonable multiple.


